Daniel Joseph
Recent graduate(May 2021) from the University of Maryland-Baltimore County. B.A. in Environmental Studies with a Minor in Emergency Health Services and a GIScience Certificate. This portfolio includes projects completed using ArcGIS, QGIS, ENVI, and R. View My LinkedIn Profile
Analysis of High School Graduation Rates
This project focuses on how different socioeconomic factors influence high school graduation rates. I specifically looked at the percent of people holding a bachelor’s degree, household income, unemployment, and families with children in poverty. Montgomery County Public School System was the study area.
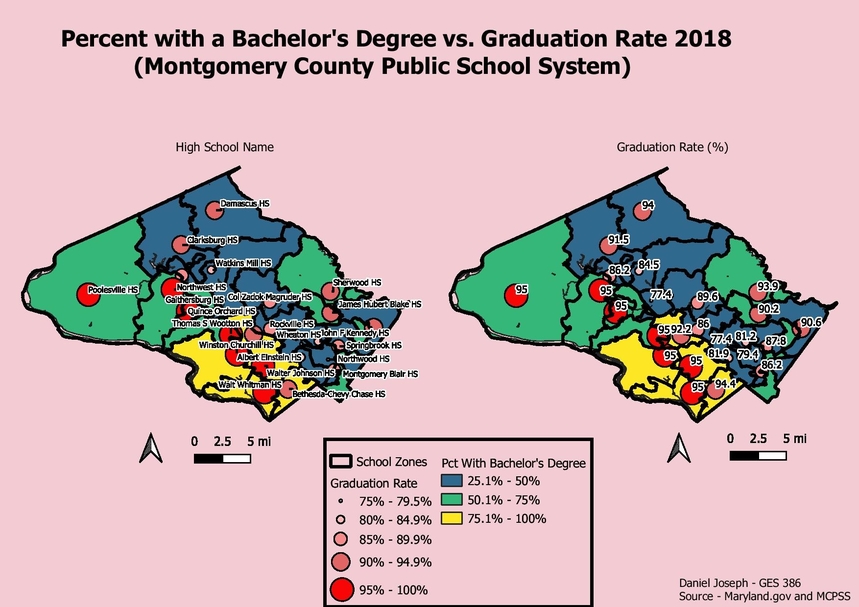
Percent with a Bachelor’s Degree vs. Graduation Rate 2018
The data was obtained from the Maryland American Community Survey. To get the average of all census blocks for each school zone, I had to use the intersect tool then dissolve by school zone. Graduated points were used to symbolize graduation rate. I used viridis and equal interval to symbolize pct with a bachelor degree.
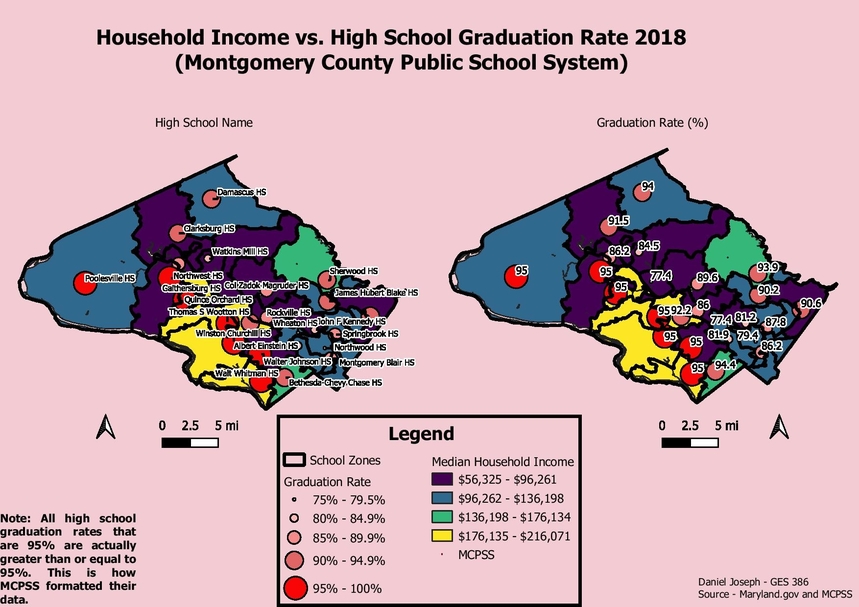
Median Household Income vs. Graduation Rate 2018
The data was obtained from the Maryland American Community Survey. I followed the same process as above to get census data for each school zone. Graduated points(white-red) were used to symbolize graduation rate. I used viridis and equal interval to symbolize household income. A label buffer was used on both maps to make the names and numbers more visible.
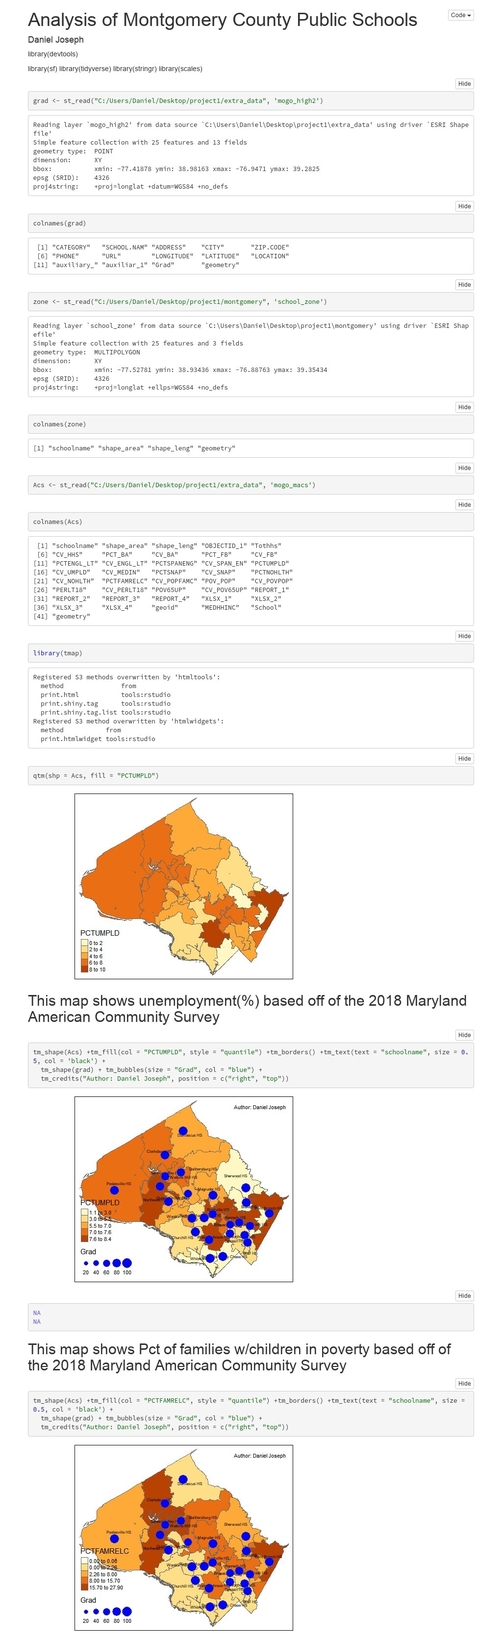
Mapping in Rstudio
The second half of the project was done in Rstudio. Tmap was the main package used for visulization. Tm_shape was used to display unemployment and poverty. Tm_bubble was used for graduated symbols. Rstudio has limitations to stylizing maps, so exporting the map to pdf and editing it in Adobe Illustrator would clean up the visuals.